
Designing an Agent Reading Test
In which I try to give people tools to understand how agents read web content, and where they fail.
Almost exactly a month ago, I wrote an article about poking around in my server logs attempting to measure agent web traffic: How to Measure Agent Web Traffic. I was trying to give our documentation platform team information to help them identify agents in our web traffic. My conclusion at the time was this:
So when it comes to user agents, I don't think we can reliably correlate a specific user agent string with a specific agent platform. But there are patterns we can look for that are probably generically "agents" - and that may have to be good enough for now.
The folks at work confirmed my findings, but then started looking into services that could track this for us. Meanwhile, in poking around in different platform offerings, I've continually seen people conflate AI model training and answer engine crawler traffic with agent traffic. For the purposes of my agent-friendly docs work, these aren't the same thing! I've been concerned about folks who don't fully understand the differences buying services that can't accurately separate those things, and then prioritizing work and taking action based on inaccurate data. So I decided to spend some more time this weekend digging into it myself to see if I can figure out how to measure agent traffic. And the answer is - yes! But I had to dive much deeper down the rabbit hole first.
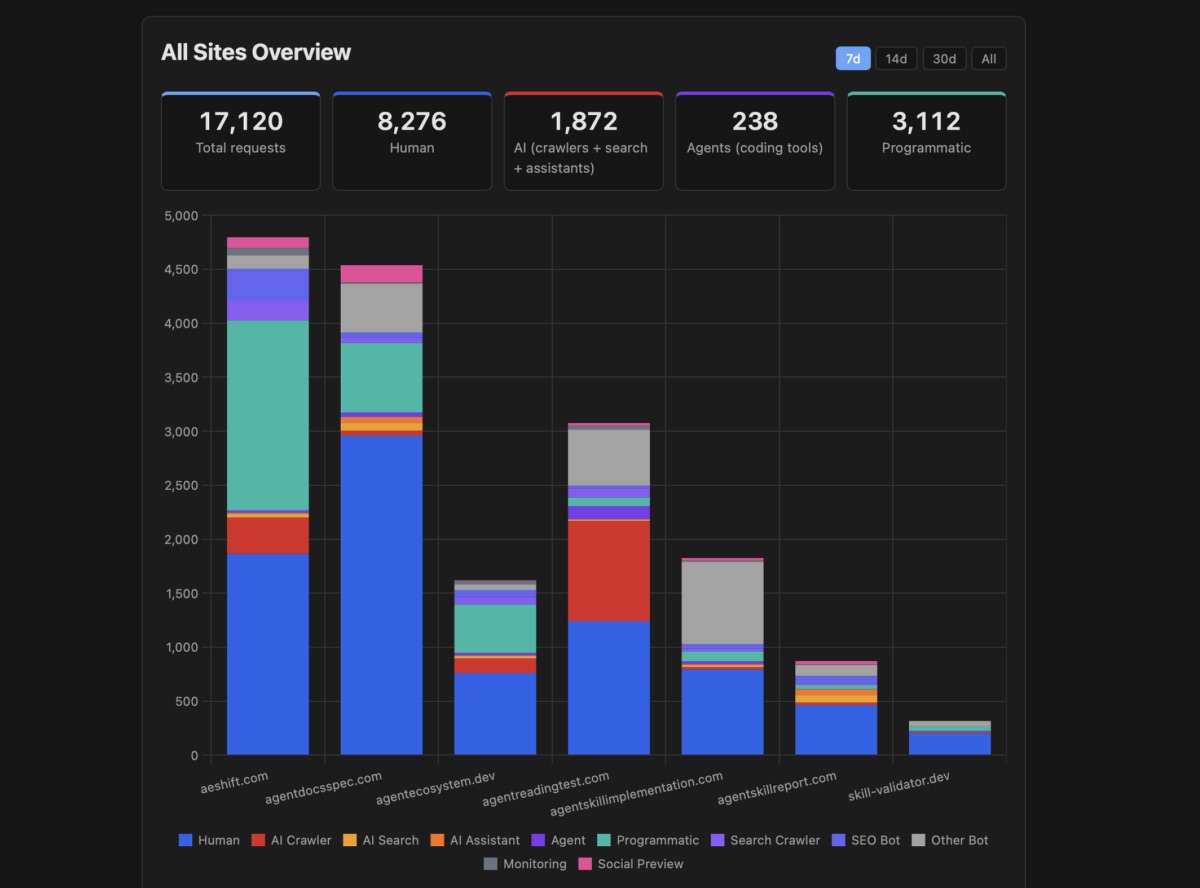
Once again, I turned to my server logs. But this time, I wasn't just poking one log. I built a metrics tracking system for myself that runs daily and:
isbot library as a fallbackThen, I built a Chart.js dashboard to display details I cared about.
Running this pipeline and displaying the details at the scale of multiple sites made it a lot easier to spot patterns to dig deeper. And the first target was: a bunch of generic node requests in the Programmatic category.
My trusty pal Claude helped me dig into the large volume of generic node requests in the programmatic access category. The traffic looked like agents - it was hitting llms.txt and various markdown pages. Surely it was an agent!
But as we dug in, the pattern was suspicious. The access was coming from a single IP address, or a small range of them, and it was accessing files too quickly. It was behaving more like a crawler than an agent, and accessing too many files. And then it hit me - it was my own afdocs tool. I've set it up in CI to run automatically on PRs and pushes to my websites. It helps me catch when I break the agent-friendliness of my sites (which I did later in this process - I stand by having it set up in CI!) But critically, I had not set a user agent on the requests. So it was just coming as generic node, the Node fetch library. So a quick version bump to afdocs now sends a proper user agent string, which lets me track it accurately as programmatic access/tooling and not an agent.
Pattern one solved.
So then I started digging into what else I could find through the server logs. I'd gotten a tip from some folks at work who spoke with a vendor who said "something has changed with Claude Code" in the last week, and now it was trackable. So I thought I'd try hitting a site with Claude Code again and see what I found in the server logs. And Lo! and Behold! Claude Code has now started sending a recognizable user agent string!
Claude-User (claude-code/2.1.92; ...)
Claude is sending the user agent string through both Claude Code and the Claude VS Code extension, so now we can see Claude visits in the server logs. Huzzah!
Second, I dug back into the GitHub Copilot embedded browser UA. From the prior article, I reported it looking like this:
Mozilla/5.0 (Macintosh; Intel Mac OS X 10_15_7) AppleWebKit/537.36 (KHTML, like Gecko) Code/1.109.5 Chrome/142.0.7444.265 Electron/39.3.0 Safari/537.36
Claude confirmed the Code/1.109.5 Chrome/142.0.7444.265 Electron/39.3.0 is a pretty unique signature for the VS Code embedded browser. It's possible that other things are using the embedded browser, but probably not in the same patterns as GitHub Copilot. So I decided to call it Copilot for now, and will walk it back if I get signal that a lot of other things are browsing to sites through the embedded browser.
So two of the agents were easy peasy. I could just get the info from the server logs.
But was there other signal that visitors might be agents? And if so, how could I get that info? This is where Claude and I started digging deep.
So the next question became - how do I spot agents that don't self-identify? The access log only captures the User-Agent string. If an agent sends a generic Chrome UA, it's invisible.
But agents don't just differ in their User-Agent. They differ in how they ask for content. A browser never sends Accept: text/markdown. That's an agent that wants markdown. But the access log doesn't capture the Accept header. So Claude and I dug into how to build something that does.
The tl;dr is - there are probably a lot of ways to accomplish this if you have more robust access to logging utilities. I'm on a shared web hosting server that doesn't expose a lot of those utilities to me directly. So instead, Claude and I worked with what we could access to build a lightweight signal tracker: a PHP shim that sits in front of the web server and intercepts three types of requests:
Accept: text/markdown (or similar) in the headers. Browsers never send this..md file requests. If something is asking for a .md file by name, it's probably not a human clicking links.llms.txt requests. The llms.txt convention is specifically designed for LLM consumption, but model training crawlers don't actually use it. So if something requests it, it's probably an agent.When one of these triggers fires, the shim logs the full HTTP request headers as JSONL, then serves the file normally. The visitor gets exactly what they asked for. We just also get to see all their headers, not just the User-Agent.
I deployed this to five of my sites and started testing coding agents against it.
Cursor was the big win. In the access logs, Cursor looks like a completely normal Chrome browser. Generic UA, no distinguishing markers. But the signal tracker caught it immediately because Cursor does do content negotiation. It sends Accept: text/markdown as its top preference. Even better: the full headers revealed a Traceparent header (OpenTelemetry distributed tracing) that normal browsers never send. And the access logs showed a second tell: the same page requested from two different IPs within one second, indicating requests are proxied through Cursor's server infrastructure.
None of these signals alone would be conclusive. But together they form a reliable fingerprint.
Gemini CLI self-identifies in its User-Agent (Google-Gemini-CLI/1.0), similar to Claude Code. It fetches HTML directly and doesn't do content negotiation, so it didn't trigger the signal tracker, but it showed up clearly in the access logs.
Windsurf uses the Go colly web scraping library with its default User-Agent string: colly - https://github.com/gocolly/colly. Since colly is a general-purpose library used by thousands of projects, that UA alone can't identify Windsurf specifically. I confirmed the attribution through timing on a low-traffic test site: the request appeared at the exact moment I told Windsurf to fetch. No other request came in 7 minutes before or 6 minutes after the Windsurf fetch. Alas, Windsurf does no content negotiation, so there's no signal tracker trigger.
OpenAI Codex CLI surprised me. It never visited the site at all. It returned page content in about 2 seconds, but no request appeared in either the access logs or the signal tracker. It appears to read from a cached content index, likely GPTBot's crawl data, rather than making live HTTP requests. You literally cannot detect it because it never comes to you.
The thing that stood out to me is that each agent approaches web access in a different way. They almost fall on a spectrum:
| Transparency | Agent | How it works |
|---|---|---|
| Self-identifying | Claude Code, Gemini CLI | Custom UA with agent name and version |
| Identifiable | GitHub Copilot | Embedded browser UA leaks IDE identity |
| Detectable | Cursor | Generic UA, but behavioral signals give it away |
| Camouflaged | Windsurf | Generic scraper library, not reliably distinguishable |
| Invisible | Codex CLI | Never visits; reads from cached index |
Out of seven coding agents tested, only three are identifiable from standard access logs. Two more require the signal tracker or behavioral heuristics. And two are effectively invisible through server-side detection alone.
The signal tracker gives us seeds: we know that a specific IP and User-Agent combination belongs to an agent. But agents don't always make just one request. Sometimes they browse around. The signal tracker might catch the first page visit through content negotiation, but subsequent requests to HTML pages from the same IP and UA won't trigger it.
So we built a session clustering system. When the signal tracker identifies an (IP, UA) pair as an agent, we look at the access logs for all requests from that same IP and UA within a rolling 60-second window. If the timestamps overlap, we expand the window and keep looking. This lets us attribute an entire browsing session to the agent, not just the one request that tripped the signal.
For Cursor specifically, we added a second heuristic: duplicate-request detection. Cursor proxies requests through its server infrastructure, so the same page gets requested from two different IPs within a couple of seconds with the same User-Agent. When we see that pattern, we can flag it as likely Cursor even without signal tracker data. We assign three confidence levels:
The proxy pattern also creates a double-counting problem. One agent visit produces two access log entries. So we collapse detected pairs: one entry gets classified as the agent, the other gets flagged as a proxy duplicate and skipped in aggregation.
With agent identification working, I added "agent" as a top-level traffic category alongside human, AI crawler, programmatic, and other-bot. This is important because agents are not the same as AI crawlers. Crawlers index your content for training or search. Agents visit your site on behalf of a specific user to accomplish a specific task, right now. The intent is different, the access pattern is different, and the implications for site owners are different.
The metrics pipeline now writes per-agent breakdowns to MongoDB: which agents visited, how many requests, how many unique IPs, what pages they hit, and what triggered the detection (content negotiation, llms.txt, direct markdown request, or UA identification). The dashboard shows agent traffic as its own tile and chart, with per-domain detail panels that break down the trigger types so you can see why each agent was flagged.
One note that probably makes sense in the context of my sites, but might be very different in a product documentation set: the agent numbers are small compared to AI crawler traffic. On any given day, I might see hundreds or thousands of AI crawler requests, but only a handful of agent visits. Crawlers are automated and continuous, while agents visit only when a human asks them to. But it also means that if you're lumping agents in with crawlers, the agent signal is completely drowned out.

This is a living system. The signal tracker runs continuously, and new agent signatures will show up as the ecosystem evolves. When they do, the raw signal logs have the full headers, so we can identify new patterns and add them to the classification rules.
A few things I'm watching for:
More agents adopting content negotiation. Claude Code and Cursor already send Accept: text/markdown. If this becomes a common pattern, content negotiation alone becomes a strong generic agent signal, even for agents we haven't fingerprinted yet. That would be a nice win: we don't need to know which agent it is to know that it's an agent.
Agents that self-identify. Claude Code and Gemini CLI already do this well. It's the same convention search engine crawlers follow with Googlebot or Bingbot: tell the site owner who you are so they can make informed decisions about their traffic. I'd love to see this become a norm for coding agents.
The invisible category growing. Codex CLI already reads from a cache instead of visiting sites. As more agents adopt similar approaches, or as agents get better at mimicking browser behavior, server-side detection gets harder. This isn't necessarily adversarial; it's just a natural consequence of how these systems are architected. But it does mean that server-side signal tracking will never give you a complete picture. I have no way of knowing how many Codex users are getting served cached content versus fresh content from my site. And since it's not fresh content, it's worth trying to figure out how often the cache gets updated, so you know how outdated your product documentation may be for Codex users.
For site owners who want to understand their agent traffic today, the practical takeaway is: access logs alone aren't enough. You need to capture full request headers, at minimum for requests that use content negotiation. That single signal, Accept: text/markdown, catches agents that would otherwise be completely invisible.
In which I try to give people tools to understand how agents read web content, and where they fail.
In which I share research about why LLM-generated output is hard to fact check.
In which verification is the hardest unsolved problem in AI content pipelines, and most organizations don't know it.

